
Availability of Drinking Water and Sanitation Over Time
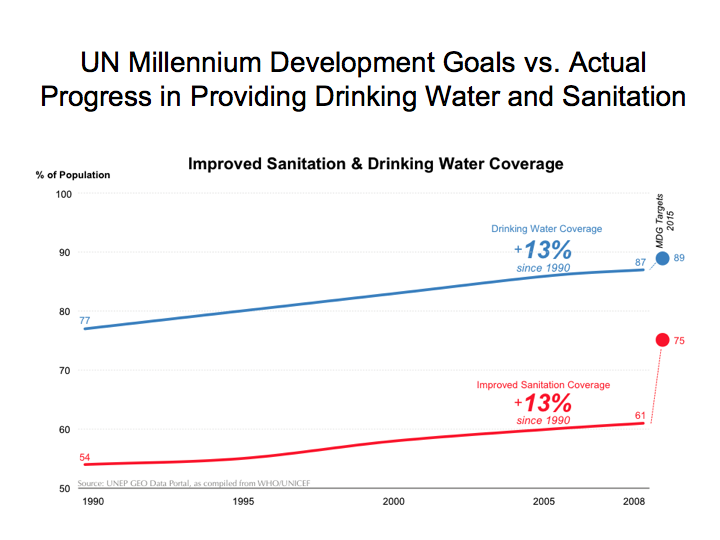
This graph charts global progress in providing access to drinking water and access to sanitation. The Millennium Development Goal numbers are plotted at the end of the graph for comparison of actual progress versus the UN's plan.
Image Type
Category
Development Issues
Freshwater
Sewage
Wastewater
Water Availability
Water Management
Water Supply
Water Treatment
Level
Source
http://www.grid.unep.ch/index.php?option=com_content&view=article&id=73&Itemid=400&lang=en&project_id=1E27F302