
VMT in CA
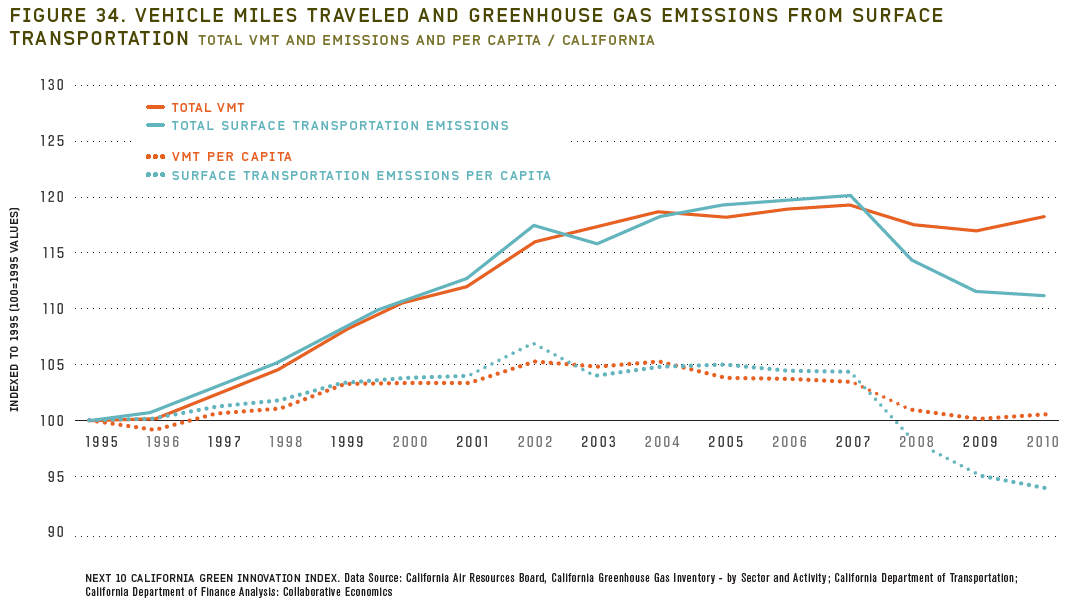
Total vehicle miles traveled (VMt) and VMt per capita declined slightly from 2007 to 2010 (-1% and -3.2%, respectively), though both increased compared to 2009 (Figure 34).
Greenhouse gas emissions from transportation dropped by a much wider margin, with a ten percent drop in per capita emissions between 2007 and 2010, and a continued
improvement since 2009 in both overall transportation emissions (-0.3%) and per capita transportation emissions (-1.1%).
Image Type
Category
Level
Geographic Area
Source
http://next10.org/sites/next10.huang.radicaldesigns.org/files/2013%20California%20Green%20Innovation%20Index%20031913.pdf