Global Trends and Governance
Number of countries from 1946 to 2011 with democracies, autocracies, and anocracies.
Category
Level
Image Type
 Visualizing sustainable solutions to global and local problems so society makes informed choices quicker.
Number of countries from 1946 to 2011 with democracies, autocracies, and anocracies.
Examples of drug-resistant infectious agents and percentage of infections that are drug resistant, by country or region
Timeline from 400BC to 2000AD showing the number of deaths from all recorded international wars, colonial wars, and civil wars.
The following table lists the top infectious disease killers which caused more than 100,000 deaths in 2002 (estimated). 1993 data is included for comparison.
This chart shows both global and regional literacy rates over a period of twenty years (1985-2005). While overall global levels have risen dramatically, education for women and in the least developed countries continues to lag.
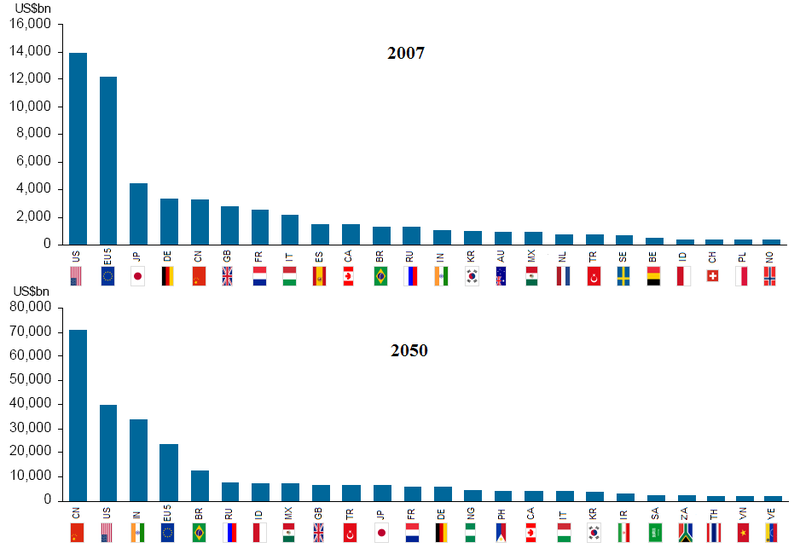
Graph showing the Capita Income 2007 and 2050 estimations.
People without Adequate Access to Food, Water and Energy from 1990 to 2030.
gcaptain.com
Sea transport is one of the least environmentally damaging modes of transport and, when compared with land based industry, is a comparatively minor contributor to marine pollution from human activities.
It is estimated that land based discharge (sewage, industrial effluent and urban/river run off etc.) and atmospheric inputs from land industry sources account for some 77% of marine pollution generated from human activities. In contrast, maritime transport is only responsible for some 12% of the total (see graphic)
This picture resume the extinction of diferent species by continent. In north america mammals and molluscs loss.So you can see in africa birds and molluscs loss. However in south america, there is not so much losses.
Millennium Ecosystem Assessment (MA)