Stunning Examples Of Data Visualization In Google Earth
Stunning Examples of Data Visualization in Google Earth
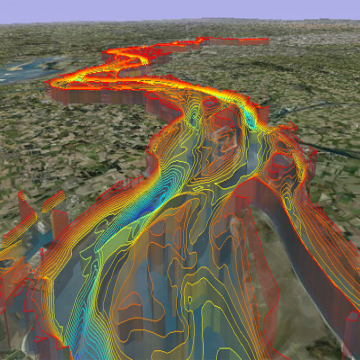
The Google Earth blog recently posted some examples of how well Google Earth can be used as a scientific visualization platform. The examples are posted by Thijs Damsma from the OpenEarth Initiative.
OpenEarth is the open source initiative to archive, host and disseminate Data, Models and Tools for marine & coastal scientist and engineers. It aims to remedy the above-described inefficiencies by providing a project-superseding approach.


 It seems like the usage of Google Earth goes way beyond checking for your neighbours garden and with the possibilities fo KML complex data visualizations in a 3D environment are at your fingertips. OpenEarth even provides some tutorials on how to get startet with these types of visualizations. Do you have any other examples of data visualization in Google Earth? Or are most of the data mash-ups done with Google Maps?
Enjoy further articles
Beautiful Infographic Posters: Analisi Grafiche
Call For Entries for Malofiej 18
You might also like
- 50 Great Examples Of Data Visualization ( Resource )
- Google Search + Data.gov + Gapminder? ( )
- Google Launches Maps Data API ( API, Geo, Mapping )
http://www.datavisualization.ch/tools/stunning-examples-of-data-visualization-in-google-earth