The world’s bleak climate situation, in 3 charts
David Roberts
David Roberts
We’re currently heading for around 3 degrees of warming
Global average temperatures have risen about 1.1 degrees Celsius since preindustrial times. At current rates, they could exceed 1.5 degrees by 2030. And global greenhouse gas emissions, after a brief lull from 2014 to 2016, are rising again.
The worst-case scenarios, nudging up to 4 or 5 degrees, seem unlikely at this point. The political and economic winds have shifted; the curve is bending.
If all the world’s countries can live up to their pledges in the Paris climate agreement, we’ll hit the year 2100 somewhere in the neighborhood of 3 degrees. So far every country has done at least a little, though very few are on track to meet their commitments.
Suffice to say, 3 degrees is worse than 2 degrees. There’s no way to pin such differences down with precision, but this graph gives you a sense and this piece (drawn from Mark Lynas’s book Six Degrees) has a good description.
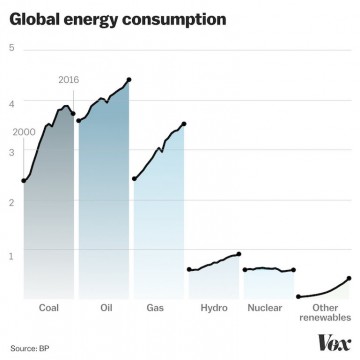
How close are we to replacing fossil fuels?
------CHART-----------
Not very close! As of 2015, renewable energy provided 19.3 percent of final global energy consumption. Excluding traditional biomass (burning wood for heat and cooking), it was 10.2 percent. Without hydro, that was 6.6 percent. Wind, solar, geothermal, and biomass electricity together accounted for 1.6 percent.
Renewables are growing faster than any other source of energy, but they’ve got a long, long way to go. As things currently stand, “because so much energy comes from coal,” Tollefson writes, “slight fluctuations from year to year can wipe out massive gains in renewables.”
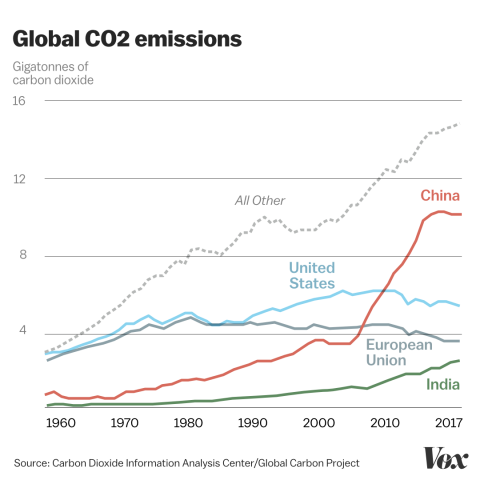
The most consequential climate decisions will happen in developing nations
-----CHART---------
In the US and the EU, emissions have largely decoupled from economic growth, trending mildly down, mostly due to decarbonization in electricity.
But emissions are on the upswing in India, and more importantly, in “all other” countries. It is rapidly developing countries like Turkey, Indonesia, and Vietnam where key decisions about 21st-century infrastructure are being made. A growing share of global coal demand comes from those countries, though the coal boom climate hawks feared seems to be slowing somewhat.
In a nutshell, hitting Paris targets will mean both that developed nations start rapidly reducing toward net-zero emissions by mid-century and that developing nations find a different path to prosperity than the one traveled by the countries around them holding all the wealth and still, on a per-capita basis, emitting the most carbon.