Why SIMCenters Are Critical Today
Where do we go to grapple with the critical issues of our time?
Our problems today are interconnected, and can't be solved in silos.
Many challenges are growing faster than our ability to solve them.
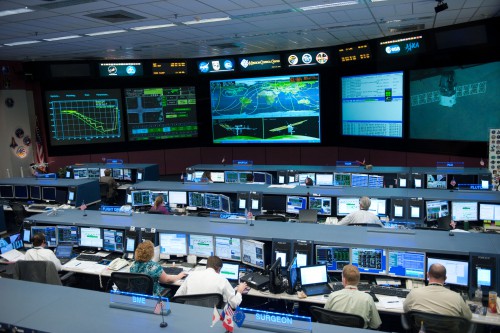
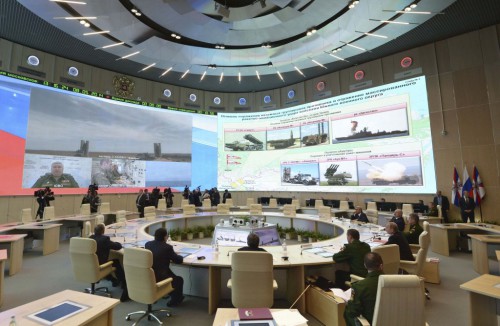
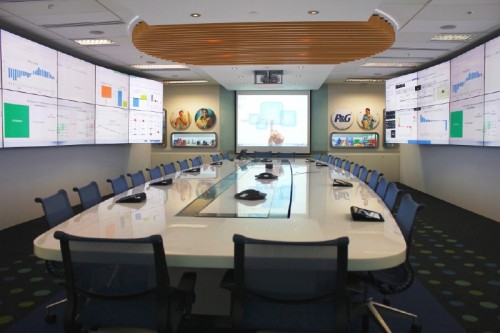
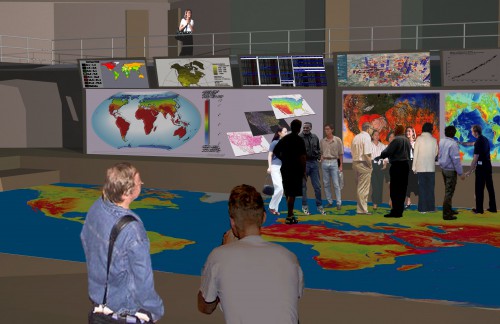
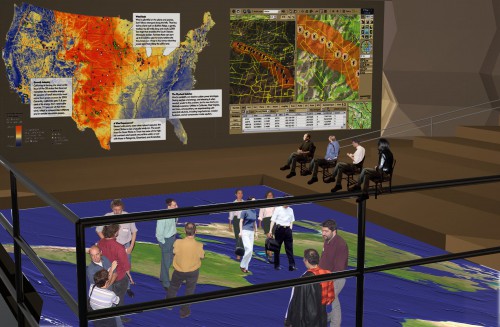
A SIMCenter is a collaborative, immersive, surround visualization facility.
It's a place where you can literally "see" the problems and solve them by working together.
A SIMCenter Enables You To:
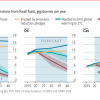
- better understand past trends,
- visualize future projections,
- compare the costs and benefits of all options,
- all to make smarter decisions quicker.
What’s wanted and needed today, and for our future, are long-term strategic planning facilities.