Pollutions affects everyone
Source
pollution on the beach
Category
Level
Image Type
 Visualizing sustainable solutions to global and local problems so society makes informed choices quicker.
pollution on the beach
Graph showing the causes of child deaths in several regions with poverty.
Picture showing the consequences the most visual in the ocean
Mapping of the 8th continent
Graphs showing several regions with capita incomes less than $1 and $1-2.
mapping of the oil spill in europe
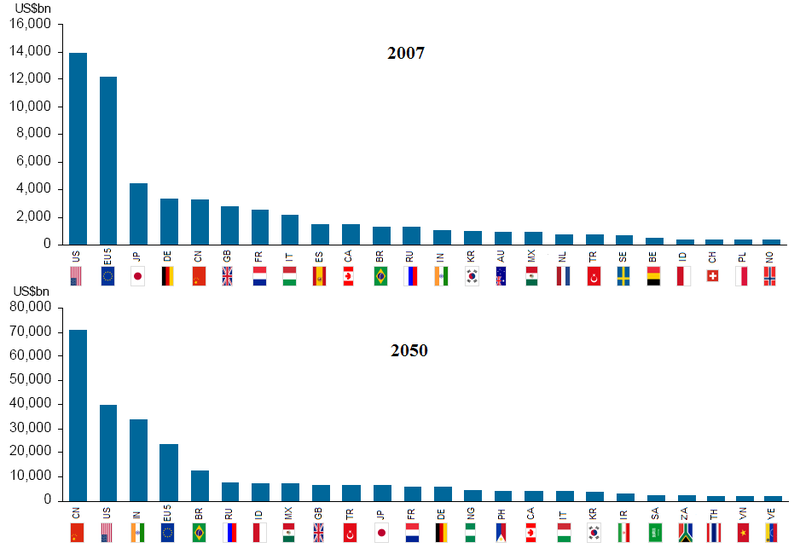
Graph showing the Capita Income 2007 and 2050 estimations.
mapping of the worst oil spill of history
Worldwide, between 1974 and 1989, there were 774 accidents involving oil spills greater than 7 tonnes. Since 1970 there have only been two major spills (more than 1000 tonnes) in Australia. The following table indicates the number of reported spills and responses pursuant to the National Plan between 1994/95 and 1998/99.
Important advances have been in the design of oily water separating equipment for machinery space bilges and oil tanker discharges, and in the monitoring and control of the discharge of such mixtures. These technological advances have allowed international regulations to be adopted, reducing the permitted operational discharge of oil effluent from machinery space bilges from 100 parts per million (ppm) to 15ppm.