
Current Trends Are Not Sustainable
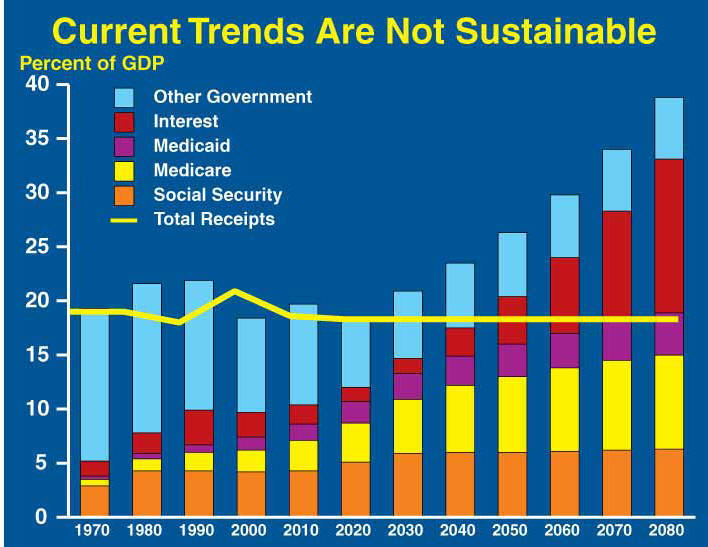
Current Trends Are Not Sustainable
This graph shows Government spending, expressed as a percent of GDP, in ten-year intervals for 1970 to 2080. The chart also shows Government receipts, expressed as a percent of GDP, as a line from 1970 to 2080.
Category
Level
Image Type
Geographic Area