Global Population growth by region
Global Population growth over the last 500 years -- with regional breakouts
Category
Level
Image Type
 Visualizing sustainable solutions to global and local problems so society makes informed choices quicker.
Global Population growth over the last 500 years -- with regional breakouts
Depiction of U.S. Waterdrawals/person
Natural Flow of Colorado River at Lees Ferry, AZ from 1906-2003 with relation to City Population Growth
daily per capita residential energy consumption - san diego 2010
Sound
This chart is dynamically updated. This page reads data from a government archive of water heights for Lake Mead from 1935 to the present, and draws the chart on that basis.
inkstain.net
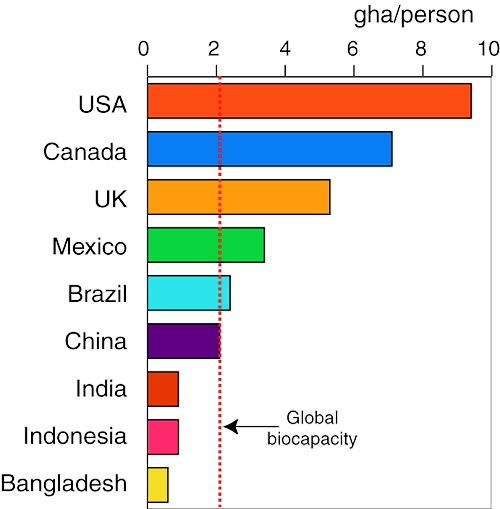
my ecological footprint
Pew Center