Underwater mortgages in US by region
Source
gotsumma
Underwater mortgages in US by region
Level
Image Type
Geographic Area
 Visualizing sustainable solutions to global and local problems so society makes informed choices quicker.
gotsumma
Underwater mortgages in US by region
Purchasing power and the US dollar
<a href="https://wrsc.org/sites/default/files/images/2011/percent_of_gdp_graph.jpeg">https://wrsc.org/sites/default/files/images/2011/percent_of_gdp_graph.j…</a>
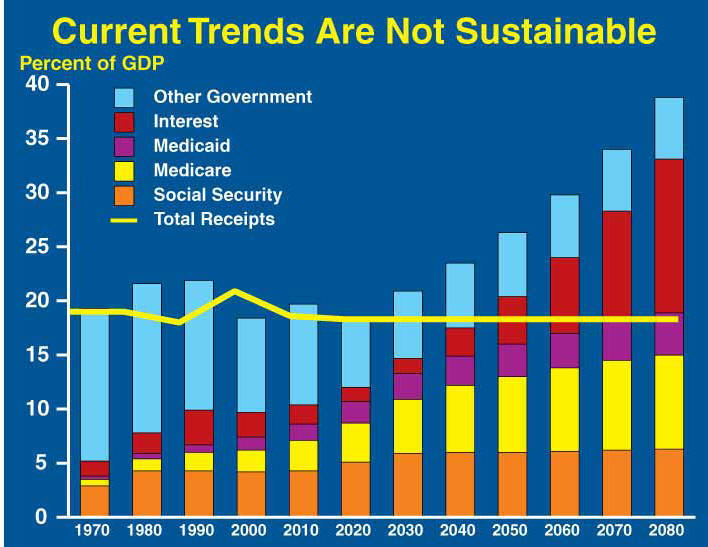
Projected spending vs.projected GDP graph
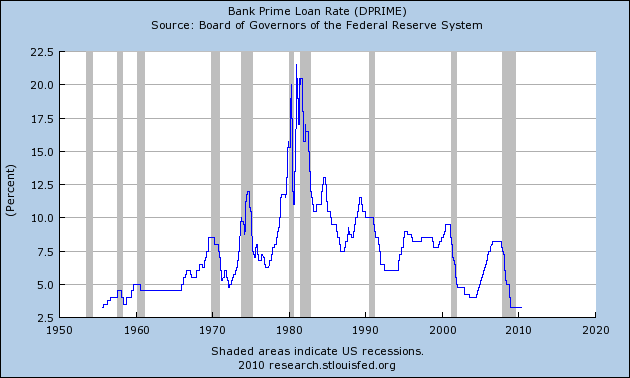
Bank prime loan rates from 1950 to 2010
Comparing job changes in different recessions in US history
Current Trends Are Not Sustainable
This graph shows Government spending, expressed as a percent of GDP, in ten-year intervals for 1970 to 2080. The chart also shows Government receipts, expressed as a percent of GDP, as a line from 1970 to 2080.
The Status and Future of the San Diego Region’s Water Supply
renewableenergyworld.com
The only updated figure from the 2009 release is Maryland, due to a new report on its offshore wind potential.
Wind Energy potential in each U.S. state by it's potential compared to its usage
Rainfall and rainfall changes in the USA
Annual Average Precipitation 1961-1990