Plastic waste causing $13bn in damage: UN

06-22-2014

Nairobi - The dumping of plastic waste into the world's oceans is causing at least $13bn a year of damage, threatening marine life, tourism and fisheries, the United Nations warned on Monday at the launch of a global environment conference.

The literacy injustice: 493 million women still can't read

06-16-2014

Fatimah Kelleher

Educating girls is now at the core of much development thinking and programming, but illiteracy among women and older adolescent girls outside formal education is an increasingly critical issue that risks falling between the gaps. 

Sustainable development goals face $2.5 trillion funding shortfall

06-24-2014

Sophie Yeo

UN report says climate, poverty and health targets will require huge cash injection from private sector

The UN’s sustainable development goals (SDGs) will fail unless governments and businesses find an extra US$ 2.5 trillion a year to support them.

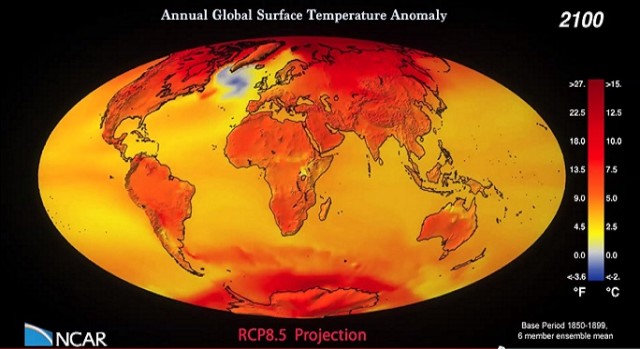
Annual CCSM4 Global Surface Temperature Anomaly, 1850-2100, RCP8.5 Projection

Submitted by patrickpoon7 on Tue, 06/24/2014 - 13:51

Global Surface Temperature Anomally from 1850 - 2100

Six ensemble average of the CCSM4 monthly surface temperature anomaly (relative to 1850-1899 average for each month) from Jan 1850 to Dec 2100, from CMIP5 historical + RCP8.5 scenario runs.

Custom Thumbnail
Level
Year

Global Carbon Dioxide Emissions by Region, 1990-2011

Submitted by c.bernhardt.14 on Thu, 06/05/2014 - 14:16

“This figure shows carbon dioxide emissions from 1990 to 2011 for different regions of the world. These totals do not include emissions or sinks related to land-use change or forestry. Inclusion of land-use change and forestry would increase the apparent emissions from some regions while decreasing the emissions from others.” – United States Environmental Protection Agency

Level
Image Type
Year

Global Greenhouse Gas Emissions by Sector, 1990-2010

Submitted by c.bernhardt.14 on Thu, 06/05/2014 - 14:01
Source
https://www.epa.gov/climate-indicators/climate-change-indicators-global-greenhouse-gas-emissions

"This figure shows worldwide greenhouse gas emissions by sector from 1990 to 2010. For consistency, emissions are expressed in million metric tons of carbon dioxide equivalents. These totals include emissions and sinks due to land-use change and forestry.

Level
Image Type
Year

Global Greenhouse Gas Emissions by Gas, 1990-2010

Submitted by c.bernhardt.14 on Thu, 06/05/2014 - 13:24
Source
http://www.epa.gov/climatechange/science/indicators/ghg/global-ghg-emissions.html

“This figure shows worldwide emissions of carbon dioxide, methane, nitrous oxide, and several fluorinated gases from 1990 to 2010. For consistency, emissions are expressed in million metric tons of carbon dioxide equivalents. These totals include emissions and sinks due to land-use change and forestry.” – United States Environmental Protection Agency

Level
Image Type

Global Atmospheric Concentrations of Carbon Dioxide Over Time

Submitted by c.bernhardt.14 on Thu, 06/05/2014 - 13:11
Source
http://www.epa.gov/climatechange/science/indicators/ghg/ghg-concentrations.html

“This figure shows concentrations of carbon dioxide in the atmosphere from hundreds of thousands of years ago through 2013, measured in parts per million (ppm). The data come from a variety of historical ice core studies and recent air monitoring sites around the world. Each line represents a different data source.” - United States Environmental Protection Agency

Level
Image Type
Year
Subscribe to Global